Practical, Self-service Marketing Analytics, Part 3: Top Five Transformation Tips
Over the last few months we, the Altair marketing team, have been eating our own dog food and using Monarch to develop our marketing KPIs and dashboard. As we’ve been transforming our marketing reporting processes, we’ve been documenting our tremendous progress in Part 1 and Part 2 of this blog series. We’re more confident than ever in the data quality of our marketing metrics, and the actionable insights we are deriving from our data. To help you in your analytics transformation journey, here are the top five tips for prepping your marketing data for analysis:
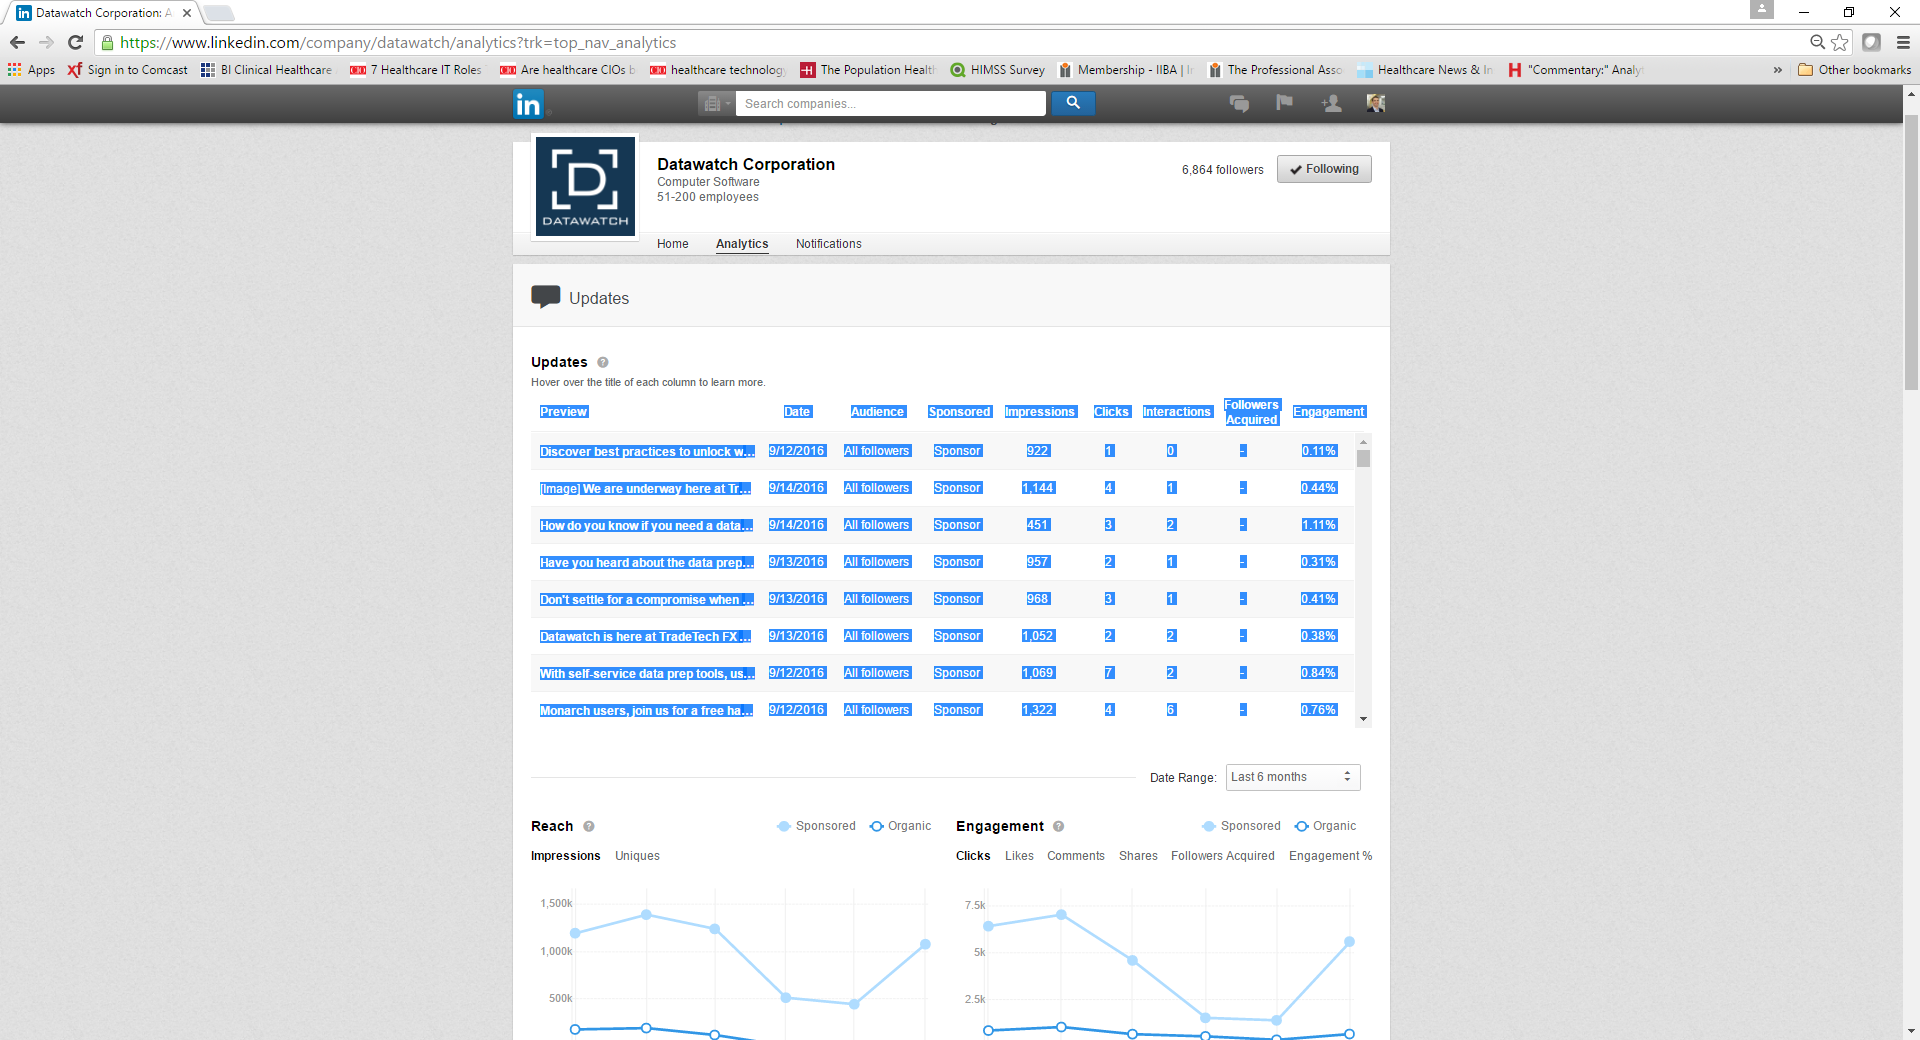
- Capture your organic LinkedIn data with drag-and-drop Having trouble capturing your organic LinkedIn performance data from your profile page? Since LinkedIn doesn’t provide an API to export this information, our team uses Monarch to simply select all the metrics within the webpage, and then drag and drop the data into our workspace. Now, it is available in a simple table, where we can manipulate the data, blend it with other data sources, and export it for visualization.
- Find the single source of truth in your CRM With a CRM system like Salesforce, it’s easy for records to be accidentally duplicated due to human error or flawed integrations with other tools. This can distort marketing projections and pipeline reporting, ultimately sidetracking the marketing team’s priorities. With Monarch, we can easily remove duplicate records and transform our CRM data.
- Get a holistic view of your customer base with blended reports When looking at siloed data, it can be difficult to truly understand what messages and content are resonating with your customers. Using Monarch’s join analysis tool, we can combine survey responses, CRM data, customer portal engagements, and email metrics to get a holistic view of our customers’ engagement. We could quickly determine the best ways to blend our qualitative and quantitative data, allowing us to spend most of our time analyzing and making strategic improvements to our marketing efforts.
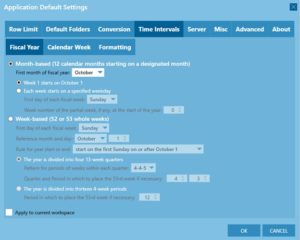
- Easily track performance by fiscal quarter and year In order to track campaign performance by fiscal quarter, many marketers utilize formulas and filters to append that information to their reports. This can be complicated, especially if the fiscal calendar doesn’t line up with the calendar year. Luckily, Monarch simplifies that process by allowing us to edit our Time Interval settings. After saving our fiscal calendar preferences, any date column in any workspace can be split into fiscal parts (year, quarter, week) with only 3 clicks of your mouse.
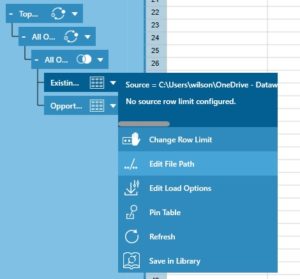
- Make a repeatable process for your reporting To run a report weekly, monthly, or quarterly in Monarch, there’s a simple way to ensure the data gets updated and automatically performs all the selected formatting changes, joins, and transformations. Simply choosing to “Edit File Path” on the out of date report allowed us to replace it with the latest report. In seconds, Monarch automatically applied our data preparation actions, and latest report was ready to be exported for visualization.
As you begin your own self-service marketing analytics journey, remember that reevaluating your current reporting processes takes time, but cleaning and combining your marketing data doesn’t have to. With Monarch, all transformations and formatting changes are just a click away, and the possible insights are endless. If you’re ready to begin your data preparation journey, get started today with your free trial of Monarch.